 |
A Noise Barrier Optimization conducted by Navcon Engineers for a Light Rail System. Step 1: To develop a 3D noise model including the Light Rail System, the topography and the community. Step 2: To define the barrier geometry next to the tracks. Step 3: Compute the noise reduction effect of each barrier section for multiple barrier heights (e.g., 30 x 1 ft) and for each receptor Step 4: Optimize the barrier geometry considering the receptor noise impact, the reductions, the cost and the visual outline of the barrier. As part of this step multiple scenarios of cost vs. improvements charts are generated to visualize the optimization. |
|
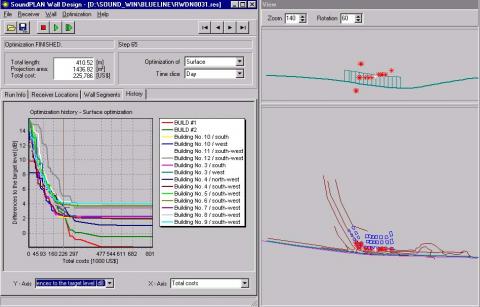
The graphic shows: Y-Axis: Sound Level Contribution [dB(A) ] X-Axis: Cost [ 1000 US$] Colored Lines: Represent 15 Receiver Locations The right graphic above shows: Site Map with receiver location Green receiver - meet target noise levels Red receiver - do not meet target noise levels The 2nd optimization restricts the maximum barrier height to 12 ft. The history shows a cost vs. noise reduction breakpoint at iteration step 65. With the barrier height restriction step 65 represents the most cost effective barrier. An extension of the barrier beyond iteration step 65 increase the overall cost of the noise barrier but it does not significantly improve the noise levels in the community. |
|
|
 |
Cost vs. Benefit Optimization Cost and surface area optimization of noise barrier along Highway & Railroad Systems or Industrial Areas Visualization of Breakpoint (where cost surpasses reduction) Effectiveness study for noise barrier scenarios with different parameter (height, length, material, active receiver locations) Documentation of the noise barrier design 3D - Graphic visualization of noise barrier Interested in a Walldesign Animation Tutorial Please downloaded: Tutorial |