The Cartography module allows advanced graphic features for all SoundPLAN Graphics. The Cartography module add additional features to the SoundPLAN Graphics such as:
adding multiple maps on a graphic sheet
adding multiple bitmaps / photos on the graphic sheet
labeling contour lines with text
defining your graphic symbols for points, lines and areas
interfacing to Google Earth Aerial Pictures in the Geo-Database (i.e., geo-referenced aerial).
interfacing to Google Earth importing topographical grid point elevation into the Geo-Database
triangulating data from noise measurement and generation of noise contour maps
adding measurement data with predicted noise levels and generating noise contour maps
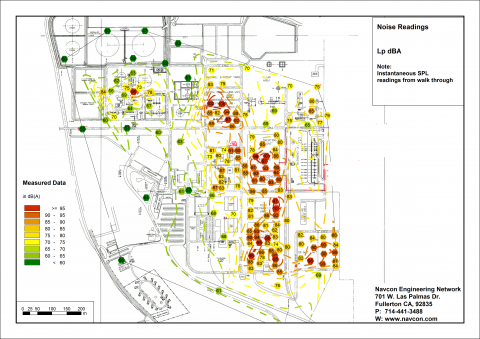
Example of a measurement map. The points represent the measurement location. The noise level at each location is color coded and dB value is shown as text. The data was contoured and the contour lines represent the existing noise levels within the plant.
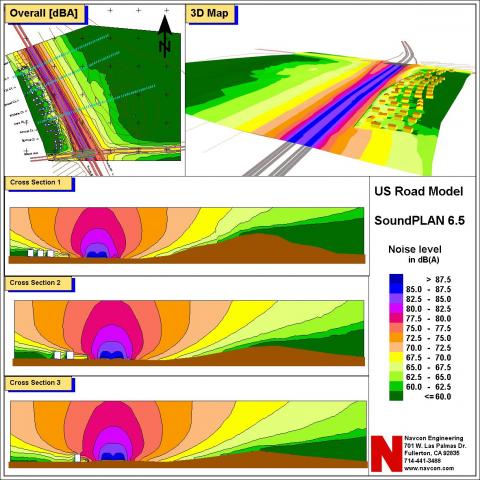
The graphic shows shows a site plan on the bottom and two cross section map above. The cross sections are displayed in the site plan with the red lines. The cartography Module allows any number of maps on a graphic. Noise contour maps can use the same noise color scale and difference maps can use a difference color scale.