|
|
The SoundPLAN Cross Section Map Module allows the prediction of sound pressure levels on an equidistant vertical grid for outdoor and indoor noise models. The cross section is defined with two points and the maximum calculation height from the lowest ground elevation found in the cross section. The graphical presentation is identical with the Grid Noise Map [Contour Maps, Difference Map]. The Cross Sectional Noise Maps created in the graphics allow the user to visualize show the shadow zone of barrier or buildings. |
 |
In combination with the Cartography you can show multiple Cross Section Maps in one Graphic and compare the difference between noise barrier or structures in the propagation path. This graphic shows the effect of noise barriers and buildings based on a TNM noise model. The top cross section shows the free field noise levels. The cross section below shows the difference levels between free field propagation and the propagation with buildings and with absorptive noise barriers on one or both sides of the freeway. |
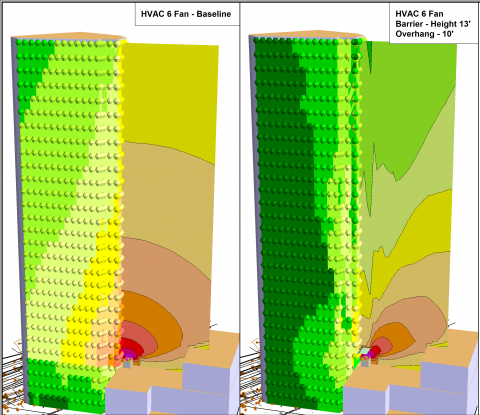 |
You can show the cross section maps with the facade noise or grid noise results. The 3D Graphic allows to show the geometry in a 3D Isometric view. The Cartography allows the mapping of multiple maps in one graphic. Here we see the noise levels from a roof top equipment radiating up a high rise building without and with a noise barrier. The cross section map visualizes the effect of the noise barrier. |
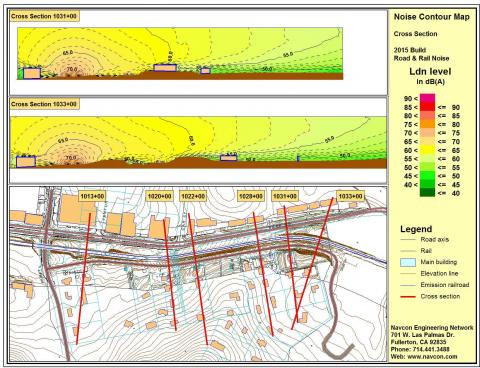 |
The Cartography allows the mapping of multiple maps in one graphic. This map shows site plan view and the cross section noise maps for two selected road cross sections. |